
Phenytoin has been a mainstay anti-seizure medication for decades, and its general mechanism is well characterized: it preferentially blocks voltage-gated sodium channels in their inactivated state, which limits a neuron’s ability to fire rapid, repetitive action potentials without necessarily shutting down normal, single firing events. In practice, that means phenytoin is expected to dampen excessive or repetitive neuronal firing rather than eliminate a neuron’s activity outright. This experiment tested that expectation directly — first by watching it happen, then by measuring it.
The recording (study S-2025-043, culture “E18 cort 25-16”) used embryonic day 18 (E18) rat cortical neurons in culture — a standard, well-established preparation for studying intrinsic neuronal excitability. Spontaneous action potentials were recorded continuously across three phases: a 5-minute baseline period (LP1), a 5-minute drug test period (LP2), and a wash period (LP3) to check for recovery after drug removal. This baseline–test–wash design is a standard way to confirm that an observed effect is actually attributable to the drug rather than to the cell drifting or degrading over the course of the recording. AP counts were taken from the last 2 minutes of each period, so each cell’s test-period firing could be compared directly against its own baseline. The paradigm was repeated across a concentration series — vehicle control, 1 µM, 3 µM, 10 µM, and 100 µM phenytoin — to capture how the effect scaled with dose.
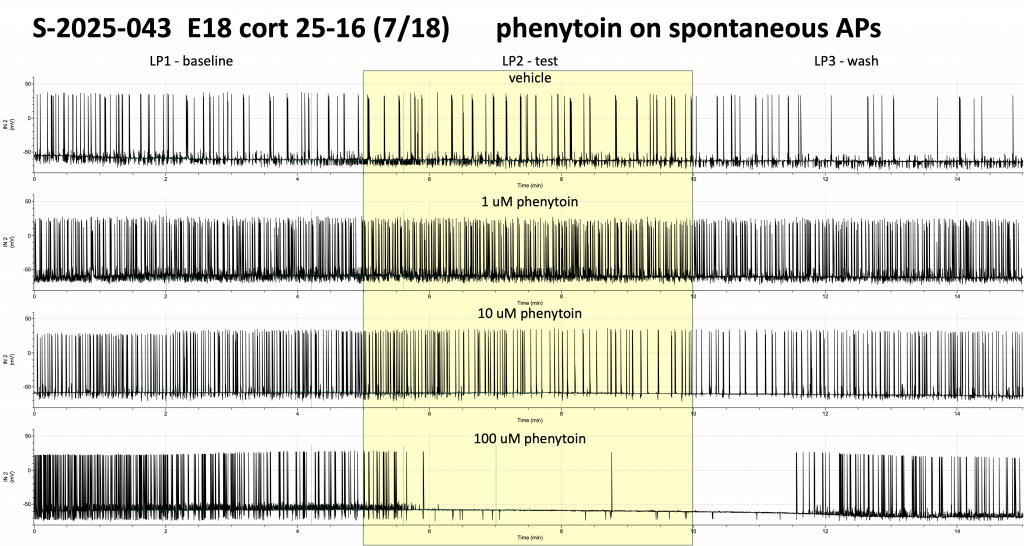
The raw traces tell a dose-dependent story at a glance. In the vehicle condition, the neuron fires spontaneous action potentials at a fairly steady rate across the full recording, with no obvious change between baseline and test windows. At 1 µM phenytoin, firing looks similarly dense and largely unaffected. At 10 µM, the firing pattern in the test window is noticeably more irregular and reduced compared to baseline. At 100 µM, the effect is dramatic: firing drops off sharply during the test period and stays suppressed well into the wash period, suggesting a strong effect that’s slow to reverse.
Quantifying that pattern across cells confirms what the traces suggest. Paired baseline-versus-test plots show that at vehicle and 1 µM phenytoin, most cells have little consistent change from baseline to test (“ns,” not significant), while at 3 µM and 10 µM, cells show a sharp, consistent drop in firing (marked ** and *, respectively). As a percent of each cell’s own baseline:
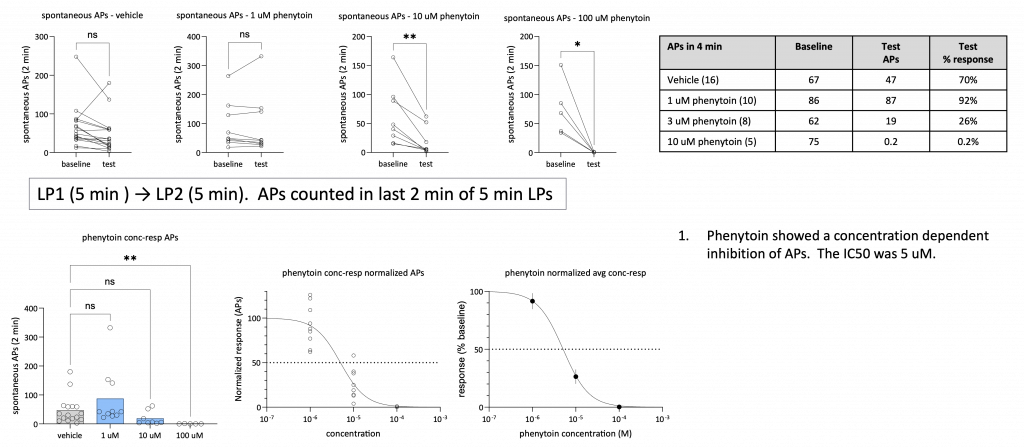
Even the vehicle condition shows some decline over time (70%), a useful reminder that spontaneous firing tends to drift somewhat over a long recording regardless of treatment — part of why the experiment relies on a paired, within-cell baseline-versus-test comparison rather than raw test values alone. Against that backdrop, 1 µM phenytoin looks essentially indistinguishable from vehicle, 3 µM produces a clear reduction in firing, and 10 µM nearly abolishes spontaneous activity altogether. Fitting this normalized response to a concentration-response curve gave an IC50 of 5 µM — the concentration at which phenytoin suppresses spontaneous firing by half, relative to baseline.
Together, the traces and the quantified analysis tell one consistent story: phenytoin inhibits spontaneous action potential firing in rat cortical neurons in a concentration-dependent manner, with minimal effect at 1 µM, partial suppression around 3 µM, and near-complete silencing by 10–100 µM, corresponding to an IC50 of 5 µM. It’s a nice example of how electrophysiology bridges the visual and the quantitative in drug discovery — you can watch a neuron quiet down on a raw trace, and then turn that observation into a defined potency number that’s directly comparable across compounds and useful for real dosing decisions.
If your program needs this kind of direct, cell-level readout on how a compound affects neuronal excitability, our electrophysiology platform is built to generate exactly this type of data — reach out to talk through your compound and experimental design.